Let’s say you’re trying to lose weight. You start doing some fitness, eat less, drink more and you try to get more sleep. When do you know if it’s working? Without getting on a scale once in a while it’s hard to know if your strategy works. Maybe you’re doing all those things and still not losing weight. It could be that you should eat more instead of less or maybe something else is wrong. To make progress, you need to start measuring and analyzing your situation.
The same is true for business decisions. Peter Drucker, a famous management guru, once said: “If you can’t measure it, you can’t improve it”. A DevOps transformations won’t succeed without measurements. If you don’t know where you at now, how would you ever know what you should improve? And how would you know if it’s working?
Microsoft recognized this early in their DevOps transformations and they take measurements very serious. In this blog post I want to discuss what Microsoft measures and how they use it to run Visual Studio Team Services and Team Foundation Server.
This is part 4 of a series on DevOps at Microsoft:
- Moving to Agile & the Cloud
- Planning and alignment when scaling Agile
- A day in the life of an Engineer
- Running the business on metrics
- The architecture of VSTS
- Changing the story around security
- How to shift quality left in a cloud and DevOps world
- Deploying in a continuous delivery and cloud world or how to deploy on Monday morning
- The end result
Where to start
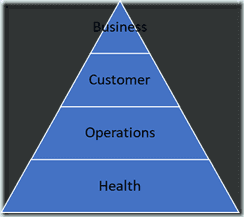
How do you start measuring something as complex as the success of your product? Designing metrics is as hard as designing new features. This means you should invest time in coming up with the right metrics and make sure that you keep monitoring your goals. It helps to divide your metrics across different categories as shown in the following pyramid:
Figure 1 Create metrics for different categories of objectives
Per category you can define the metrics that help you in running your product. It also helps to start measuring the thing that currently hurts you most and what’s most important to evolve. Be aware of creating to many metrics. If members of your team can’t remember the number of metrics from the top of their mind, you have too many metrics. You should also follow the general principle of making your goals SMART:
- Specific
- Measurable
- Achievable
- Relevant
- Time bound
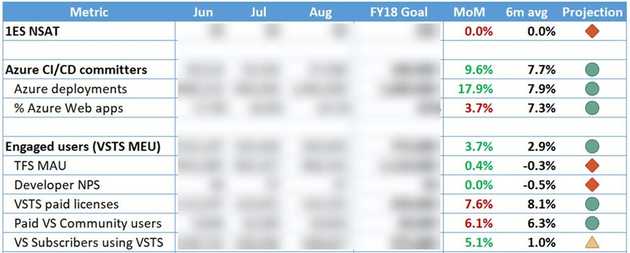
The yearly goals that you create can then help run your team and give focus to what they are doing. The following gives a high level overview of the yearly goals of the VSTS team. In the following paragraphs I’ll discuss some of the specific measurements that the VSTS team uses to give you some inspiration.
Figure 2 An example of the year goals of the VSTS team
Health
The health of your application forms the basis of your success. If your product is plagued by outages, bugs and other disruptions, you will never achieve your other goals. The key question you should ask yourself is:
Are customers able to reliably use our service without interruption, blocking issues or performance delays?
You can measure this by looking at metrics such as your live site incidents by severity and impact, the amount of technical debt, amount of production support, and metrics such as Mean Time to Detection / Mitigation / Resolution.
Operations
They key question for your operational goals is:
Are we operating our service efficiently, utilizing our resources in a scalable way to meet both our budget and growth targets?
Examples of metrics that you can set for operational goals are mostly cost driven. What are the costs per engaged user? What does it cost us to do a new release? What is ratio between users of our application and the number of people we need to support it?
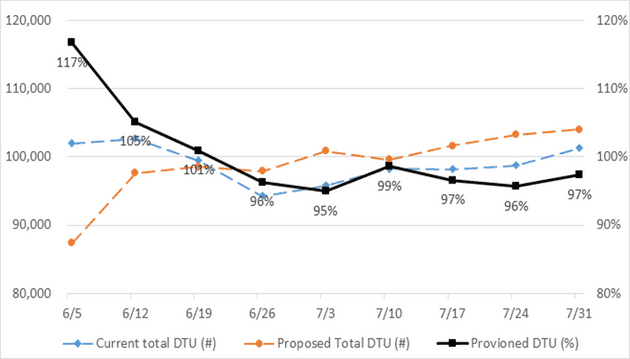
An example that I see come up at customers and that Microsoft also struggled with is the sizing of your SQL Azure capacity. SQL capacity is measured in Database Transaction Units (DTU). DTU determines the amount of resources you have available to run your database. A DTU is a blended measure of CPU, memory, I/O (data and transaction log I/O). When you create a Azure SQL Database you select a performance level that your database should run at. If you go over the assigned DTUs your database is throttled. It’s not uncommon for teams to assign more capacity then they actually need. Although this means you always have enough capacity for your load, you also spend a lot of (unnecessary) money.
The following graph shows a measurement of the provisioned DTU for VSTS and the actual load against a database. Visualizing this data and making it available to individual teams, helped them to see how many DTU they had provisioned and how much they were using. Over time they adjusted their configuration and dropped SQL costs by 33% while growing usage by 22% over a 6 month period.
Figure 3 By measuring your database load and capacity you can optimize your costs
Customer
If you have a stable service running and you optimize your operational costs, you can look at the next level of success: your customers. If your customers aren’t happy with your application, you won’t get any further. The key question about customers is:
Are we delivering value to customers fast enough to meet their evolving needs in a way that they can use and that they like?
Metrics you can use are lead time, the number of epics delivered, your release cadence, customer satisfaction and customer defined metrics.
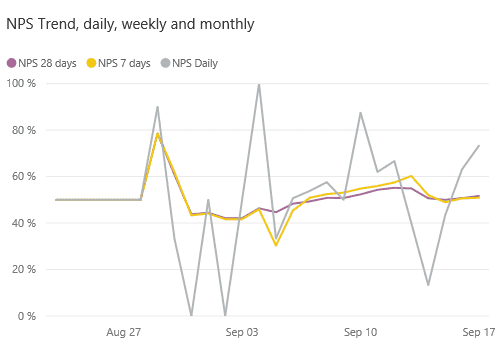
A popular way to track customer value is by using the Net Promoter Score. NPS measures if your customers are raving fans or if they hate your product. This is done very simply by asking a customer how likely they are to recommend your product to someone else on a scale of 0 to 10. Everyone with a score of 9 or 10 is a promoter, 0 to 6 is a detractor and 7 and 8 are passives. You then calculate NPS by subtracting the percentage of customers who are detractors from the percentage of customers who are promoters. This means that your score goes all the way from -100 (everyone is a detractor) to 100 (everyone is a promoter). A positive score is good and a score above 50 is excellent.
The VSTS team first started tracking NPS by sending out quarterly emails to customers asking them if they want to recommend VSTS on a score of 0-10. The questionnaires also contain a single text field where someone can explain their choice. This already gave a lot of information but it also limited the group who answered to people only in the US who accepted to receive these types of emails. VSTS is now moving to an in product prompt where someone can quickly select a value and enter a comment. Of course this is configured in such a way that people aren’t spammed with questions. The following figure shows an example NPS graph.
Figure 4 The NPS trend gives a clear metric of how happy customers are with VSTS
Since the verbatim responses can easily grow out of control, Microsoft uses a combination of machine learning and crowd sourcing to get the key themes of the feedback. These are then discussed and used to interpret the NPS score and help with planning.
Tracking customer support cases is also a way to measure customer happiness. By tracking the number of cases and how long it takes to resolve them you can set goals based on the areas with the most cases. These support cases are then put on the backlog of the affected areas and completed by the responsible team.
Business
Finally, you need to know how your overall business is doing. Having happy customers on an excellent platform won’t last long if you’re losing money. The key question is:
Are we meeting the needs and objectives of our business?
This means of course that you need to know what your objectives are. Examples are earnings, market share and the number of engaged users. These metrics influence your acquisition funnel, pricing model and other important business decisions.
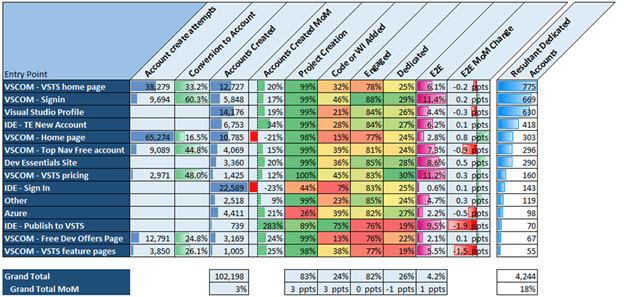
VSTS has a complex acquisition funnel with multiple entry points such as visualstudio.com, the Visual Studio IDE, and the Azure Portal. Take for example the following diagram detailing the different funnels and the steps that follow:
Figure 5 The acquisition funnel for VSTS
By tracking these metrics, you can see which funnels are successful and where you want to invest.
Watch for unintended consequences
Metrics drive behavior. This is what you want but you need to watch out for unintended consequences. An example of this is a metric that tracks how many VSTS accounts are created over time. Your first idea might be that more accounts sounds like a good thing. To help with this, a team decided to automatically create a VSTS account for everyone that signed in into Visual Studio. Of course this resulted in the number of accounts metric growing like crazy. But most of those accounts stopped at the first step in the funnel. They never created a project, let alone add code and actually start doing something with it. This behavior was driven by a metric but caught by measuring the end to end scenario.
What you want to achieve is a culture of learning. Make sure that all team members get regular updates of the key metrics and use this to set goals and keep learning what works and what doesn’t. By taking this a step further you can start running A/B experiments and actually measure the outcome of those experiments.
Conclusion
This wasn’t the most technical blog but it’s still the foundation of your DevOps transformation. Split your metrics across categories and start with areas where you want to improve or where there are a lot of problems,. Define a a small set of metrics for these areas and use them to guide your DevOps transformation.
In the next part, we’ll dive into software architecture challenges that you come across when moving to the cloud and adopting a DevOps culture.
